
Enable Incremental fetch in MSTR documents

Enable Incremental fetch in MSTR documents


Incremental fetch divides large documents or layouts into pages, thereby loading the data in batches (or blocks) rather than all at the same time. This improves the usability and performance of a large document or layout, by reducing the load and overall memory usage on the web server.


To apply incremental fetch to a document

  • In MicroStrategy Web, open the document in the Document Editor.
  • If the document contains multiple layouts, select the layout to apply incremental fetch to.
  • From the Tools menu, choose Document Properties. The Document Properties dialog box opens.
  • On the left, under Layout Properties, select Advanced.
  • Select the Enable Incremental Fetch check box.
  • From the Fetch Level drop-down list, select the object to be counted for the incremental fetch level.
  • If the document or layout is grouped, the groups are displayed in the drop-down list. Groups that are displayed as a single element only are not shown on this list.
  • If the document or layout is not grouped or all the groups are displayed as single elements only, the only option is the Detail section.
  • Enter the Block Size, which is the number of objects (of the Fetch Level) that are returned in each block.
  • Click OK to return to the document.

Incremental fetch on Grid/Graphs

Incremental fetch divides large Grid/Graphs into pages, thereby loading the data in batches rather than all at the same time. This improves the usability and performance of a large Grid/Graph, by reducing the load and overall memory usage on the web server. Only a Grid/Graph displayed as a grid can be split into rows or blocks, and therefore incrementally fetched. This includes the grid portion of a Grid/Graph displayed as both a grid and a graph simultaneously.
This setting applies only to the rows, not the columns, of the Grid/Graph.
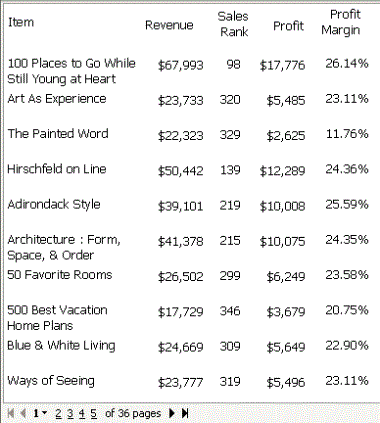
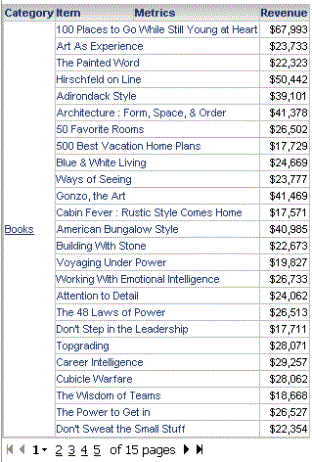
The batches of data are defined by the number of rows or blocks to return at a time. For example, a Grid/Graph on a document contains 360 rows. Incremental fetch is applied, with the number of rows per page set to 25. Only 25 rows are displayed on a single page of the Grid/Graph. Users can click the page numbers at the bottom of the screen to display more information. The document is shown below in Interactive Mode in MicroStrategy Web:

Comments

Post a Comment

Popular posts from this blog

Microstrategy Dashboard performance improvements steps

Microstrategy  Dashboard performance improvements steps: Many times, causes of poor performance can be simplified to specific components. To troubleshoot performance issues, users must identify these components, then make the appropriate modifications to the environment and/or to the MicroStrategy dashboard to reduce bottlenecks. Dashboard execution stages can be represented below: MicroStrategy Intelligence Server When an end user makes a  Document Execution Request  through any client (a web browser via MicroStrategy Web, the MicroStrategy Desktop/Developer client, the MicroStrategy Mobile app, or the MicroStrategy Office client), the request is sent to the MicroStrategy Intelligence Server, which processes the request and prepares the response. The MicroStrategy Intelligence Server will execute all children datasets on the dashboard by either generating SQL and running this against the data warehouse, or by fetching data from a cache. The Inte...

Case functions Microstrategy

Ca se functions Microstrategy Case functions return specified data in a SQL query based on the evaluation of user-defined conditions. In general, a user specifies a list of conditions and corresponding return values. Case This function evaluates multiple expressions until a condition is determined to be true, then returns a corresponding value. If all conditions are false, a default value is returned.  Case  can be used for categorizing data based on multiple conditions. This is a single-value function. Syntax Case ( Condition1 ,  ReturnValue1 ,  Condition2 , ReturnValue2 ,...,  DefaultValue ) Example Case(([Total Revenue] < 300000), 0, ([Total Revenue] < 600000), 1, 2) sum(Case (Day@DESC in (ā€œSatā€,ā€Sunā€), Sales, 0) {~+} Sum(Case(Category@DESC In("Books","Electronics"),Revenue,0)){~+} CaseV (case vector) CaseV  evaluates a single metric and returns different values according to the results. It can be used to perfo...

MicroStrategy URL API Parameters

MicroStrategy URL Structure The following table summarizes the root URL structure used for every request to MicroStrategy Web. Environment Main Application URL Administration URL J2EE http://webserver/MicroStrategy/servlet/mstrWeb http://webserver/MicroStrategy/servlet/mstrWebAdmin .NET http://webserver/MicroStrategy/asp/Main.aspx http://webserver/MicroStrategy/asp/Admin.aspx Every request sent to MicroStrategy Web calls a central controller. Parameters are appended to  Main.aspx  or  mstrWeb  (in a .NET and J2EE environment, respectively) to indicate to the controller how the request should be internally forwarded and handled. The following examples show a URL for accessing a MicroStrategy folder when the user does not have an existing session. The URL contains not only the parameters needed to connect to MicroStrategy Web, but also the parameters needed to log on and create a session. J2EE environment: <a href="http:...

Control the display of null and zero metric values

Show   Control the display of null and zero metric values in a grid report You can determine how to display or hide rows and columns in a grid report that consist only of null or zero metric values. You can have MicroStrategy hide the rows and columns in the following ways: Hide rows and columns that consist only of null metric values Hide rows and columns that consist only of zero metric values Hide rows and columns that consist only of null or zero metric values (default) Once you have defined how MicroStrategy hides null and zero metric values in the grid, you can quickly show or hide the grid using the Hide Nulls/Zeros option in the Data menu, as described below, or by clicking the  Hide Nulls/Zeros  icon  in the Data toolbar. To determine how null and zero metric values are displayed or hidden in a grid report Open the report in Edit mode. From the  Tools  menu, select  Report Options . The Report Options...

Create a transaction services photo uploader

Create a transaction services photo uploader   1.  Create a new table "photo_upload" in Tutorial warehouse database (the default location: C:\Program Files\MicroStrategy\Tutorial Reporting\TUTORIAL_DATA_7200.mdb), as shown below:    2. The 'photo_upload' table has to be pre-populated with *exactly* 10 rows of data, the values for the 'ID' column should be 1-10 and the values for the 'uploaded' column should all be 0 3.  In MicroStrategy Desktop, create a freeform report "R1" based on the new table "photo_upload" in Tutorial data created at step 1, as shown below:   SELECT Location, Description, ID, uploaded, numbers FROM PHOTO_UPLOAD 4.  Create another table for transaction insert SQL. Make sure to create an 'autonumber' type ID as primary key for this table, or auto_increment ID for different DBs.                     5. Create...
Star schemas and aggregate (or summary) fact tables Aggregate tables can further improve query performance by reducing the number of rows over which higher-level metrics must be aggregated.  However, the use of aggregate tables with dimension tables is not a valid physical modeling strategy. Whenever aggregation is performed over fact data, it is a general requirement that tables joined to the fact table must be at the same attribute level or at a higher level. If the auxiliary table is at a lower level, fact rows will be replicated prior to aggregation and this will result in inflated metric values (also known as "multiple counting"). With the above Time dimension table, a fact table at the level of Day functions correctly because there is exactly one row in DIM_TIME for each day. To aggregate the facts to the level of Quarter, it is valid to join the fact table to the dimension table and group by the quarter ID from the dimension table. Sql select DT...

Configure a report for use with Bulk Export in MicroStrategy

Configure a report for use with Bulk Export in MicroStrategy The Bulk Export feature enables a large report to be saved as a delimited text file. Using this feature, it is possible to retrieve result sets from a large dataset without having to load the entire dataset into memory. PS:  Once a report is setup for bulk export it cannot be used as a regular report. So if the report needs to be run as a normal report and as a bulk export report, the first step is to make a copy of the report for use with bulk export. Configure Bulk Export Bulk Export options are only available in MicroStrategy Developer. Open a 3-tier connection using MicroStrategy Developer and edit the desired report. Go to 'Data' on the top menu bar. Select 'Configure Bulk Export': Specify any additional desired configuration options. General Settings Bulk export database instance : This is the database instance to use to store the bulk export results. Temporary tables w...

Search for Freeform SQL Reports in MicroStrategy Developer

Search for Freeform SQL Reports in MicroStrategy Developer Steps below will guide to find out all the Freeform SQL Reports in a project in MicroStrategy Developer: Log in to the particular project from Developer and click the search button or use Control +F Go to Tools > Options > Enable "Show ' Contains ' and ' Contained by ' tabs" as shown below: 3.  Click OK > Go to "Contains" tab and select Logical Table for "Contains any object of this type" as shown below:  4.  Then go to Object Types tab and select Report as the object as shown below: 5. Click Find Now and all Freeform SQL Reports will be displayed.

Microstrategy Dossiers explained

Microstrategy  Dossiers With the release of MicroStrategy 10.9, we’ve taken a leap forward in our dashboarding capabilities by simplifying the user experience, adding storytelling, and collaboration.MSTR has  evolved dashboards to the point that they are more than dashboards - they are  interactive, collaborative analytic stories . Ultimately, it was time to go beyond dashboards, both in concept and in name, and so  the've  renamed VI dashboards to  ā€˜ dossiers ’.  Dossiers can be created by using the new Desktop product or Workstation or simply from the Web interface which replaces Visual Insights. All the existing visual Insights dashboards will be converted to Dossiers   With MicroStrategy 10.9, there was an active focus on making it easier to build dashboards for the widest audience of end users. To achieve this, some key new capabilities were added that make it easier to author, read, interact and collaborate on dashboards ...

Multi-Table Data Import(MTDI) from one or more supported data sources

Multi-Table Data Import(MTDI) from one or more supported data sources In MicroStrategy Analytics Enterprise Web 10 onewards, users can now simultaneously import two or more tables from one or more supported data sources, this feature is called Multi-Table Data Import (MTDI) which has been renamed as Super Cubes in MSTR 2019 (Does it sound like multisourcing for all the users without admin help?) Currently, all connectors in MicroStrategy Web 10 except " OLAP " and " Search Engine Indices " support Multi-Table Data Import. Users are able to add multiple tables/files when doing data import from single connector, as shown below: Users are also able to combine multiple tables/files from different sources and store them into one single Intelligent Cube, as shown below: