
Customers Who Live in the Same City as Call Centers

Customers Who Live in the Same City as Call Centers

Your new utility company has call centers located throughout the country, and your recent surveys indicate that customers who live in the same city as a call center are particularly satisfied with service due to extremely rapid repairs during power outages. To begin your new advertising campaign, you want to generate a list of Call Centers that coincide with Customer Cities.

The following steps create an attribute-to-attribute qualification filter that generates the list of desired cities.

To Create an Attribute-To-Attribute Qualification that Compares the Call Center and Customer City Attributes

  1. In MicroStrategy Web, log in to a project.
  2. Open any folder page (for example, click Shared Folders on the home page).
  3. Click the Create Filter icon .
  4. From the Object browser on the left, select the Customer City attribute from the Customers hierarchy and drag it to the filter pane on the right.
  5. Change Qualify to ID.
  6. Change the operator to Equals.
  7. Click the Select Attribute icon .
  8. Select the Call Center attribute from the Geography hierarchy.
  9. Click OK.
  10. Click the Apply icon .
  11. Save and close the filter, naming it Customer City = Call Center.

    Now that you have created the attribute-to-attribute qualification filter, create a report and add the filter.

To Create the Report

  1. In MicroStrategy Web, log in to a project.
  2. Click the MicroStrategy icon  at the upper left of any page and select Create Report.
  3. Add the Customer City attribute to the report.
  4. Add the Customer City = Call Center filter to the report.
  5. Save the report, and then execute it.

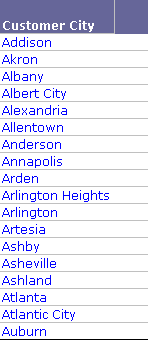
    When the report is executed, only a small subset of the total number of Call Center attribute elements are displayed. Each of the elements (cities) present on the report is also a Customer City.

Comments

Post a Comment

Popular posts from this blog

Microstrategy Custom number formatting symbols

Custom number formatting symbols If none of the built-in number formats meet your needs, you can create your own custom format in the Number tab of the Format Cells dialog box. Select  Custom  as the Category and create the format using the number format symbols listed in the table below. Each custom format can have up to four optional sections, one each for: Positive numbers Negative numbers Zeros Text Each section is optional. Separate the sections by semicolons, as shown in the example below: #,###;(#,###);0;"Error: Entry must be numeric" For more examples, see  Custom number formatting examples . To jump to a section of the formatting symbol table, click one of the following: Numeric symbols Character/text symbols Date and time symbols Text color symbols Currency symbols Conditional symbols Numeric symbols For details on how numeric symbols apply to the Big Decimal data type, refer to the  Project Design Guide . ...

No 'Alert' option appear when trying to create an alert-based subscription in MicroStrategy Distribution Services

The 'Alert' option does not appear when attempting to create an alert-based subscription in MicroStrategy Distribution Services In MicroStrategy Distribution Service 9.x and 10.x, and 11.x versions it is possible to create an alert-based subscription. When right-clicking the metric header of a report in MicroStrategy Web 9.0.x, the 'Alerts' option does not appear:    Cause : This issue occurs because the user attempting to create the alert does  not have all of the necessary privileges on alerts.   Fix : In order to create an alert-based subscription, the following privileges are required: In order ti get permissions to create alerts the user should be given the following privileges by the admin: New Version of Microstrategy 11.x: Server- Distribution: Older Versions of Microstrategy 9.x, 10.x etc..: Web Reporter > Web user Web Analyst > Web create alert   ...

Compound key attribute

Compound key attribute A compound key attribute is an attribute whose primary key is made up by the combination of two or more columns. The multiple columns are joined with other attributes, typically in a many-to-many relationship . To create a compound key, users must create multiple attribute forms, group them together and set the form group as the key for the attribute. Use the same steps as specified in the help menu: Open attribute editor (right-click on attribute and select 'Edit') Select the forms that will make up the compound key From the 'Edit' menu, choose 'Group' NOTE: Modifying the key form will trigger required updates when saving. This may make related application objects (reports, filters and metrics) unusable. Click on 'Yes' to continue, when prompted, in a dialog box, to confirm this action Save the changes. Choose 'Update Schema' from the Schema menu

Reduce Intelligent Cube Size By Finding Intelligent Cube Objects Which Are Not In Use

Reduce Intelligent Cube Size By Finding Intelligent Cube Objects Which Are Not In Use If the i-cubes can potentially be reduced in size an audit can be performed on the cube objects to see which cube objects are not being used by any of the view reports, documents, or dossiers.   The below are examples for a few of the common metadata database platforms . NOTE: To perform this audit, queries are run against the MicroStrategy metadata database. Ensure a metadata backup is taken prior to performing the below actions. Steps: 1) Identify the object ID of the Intelligent cube to be audited by checking the objects Property window 2) Identify the object ID of the project this cube exists within by opening the Project Configuration Sample Cube ID =   CFAF1E9B4D53990698C42E87C7AF2EB5 Sample Project ID =  B7CA92F04B9FAE8D941C3E9B7E0CD754   3) Run the below SQL against the metadata database by replacing the Cube ID and Project ID within the respective ...

Microstrategy Removing sections that do not have metric data

Removing sections that do not have metric data This is an interesting feature which might not be explored by many of us and it comes us handy. A  cross join between datasets can result in rows or Group Header/Footer sections that do not have metric data. For example, a document contains two datasets. Dataset 1 contains Year and Revenue, with data for three years (2007-2009). Dataset 2 contains Year and Profit, filtered to return data for only two years (2008 and 2009). If you place Year and Profit in the Details and execute the document, it displays three rows, although no profit data exists for 2007. This is a product of the cross join between the two datasets. You do not want to see the blank line for 2007 since it does not give you any data for profit. You can select the  Trim sections for which no metric value data is available  check box. This removes the row for 2007, since no metric data for Profit is available for 2007. The results are shown below: ...

Metadata Doctor (MD Doctor) in Microstrategy

Metadata Doctor (MD Doctor) in Microstrategy Metadata Doctor (MD Doctor) is a utility that detects and fixes certain physical inconsistencies in MicroStrategy 9.4.x - 9.5.x metadatas that may prevent MicroStrategy 9.4.x - 9.5.x products from functioning correctly.  In simple terms, it detects physical inconsistencies by running SQL against different metadata tables and then comparing results.  If an entry is found in one table but not in the main lookup table of the metadata then that denotes a physical inconsistency and MD Doctor will  delete  that orphan entry.  Note:  MD Doctor is not a supported tool for MicroStrategy 10.x metadatas. NOTE:   MD Doctor should be used only after a metadata backup has been taken.  MD Doctor should not be used repeatedly.  It is meant to primarily serve as a quick-fix to physical inconsistencies and get environments up and running.  If repeated use of MD Doctor is needed then ...

Algorithm to calculate Logical Table Size in Microstrategy

How are the fact tables determined using the logical table size for SQL generation in MicroStrategy The logical table size is an integer number that represents the granularity or level of aggregation of a particular table. It is called 'logical' because it is not related to the physical size of the tables (number of rows). It is calculated according to the attribute IDs that are present in the table and their level in the system hierarchy.   Even though, the number does not reveal the actual number of rows in the table, it is an accurate way of measuring a table size without having to access its contents.   IMPORTANT:   The system hierarchy is defined by the parent-child relationships between attributes of the same family (formerly known as a dimension), not by user-defined hierarchies (i.e., drilling hierarchies).   MicroStrategy Engine utilizes an algorithm based on attribute keys to calculate the Logical Table Size (LTS): Given the following tables: ...

Replace object names in bulk using MicroStrategy Repository Translation Wizard

Replace object names in bulk using MicroStrategy Repository Translation Wizard Users may need to replace  object names  in bulk.  This can be done using MicroStrategy Repository Translation Wizard in MicroStrategy Developer 9.4.x - 10.x.  Follow the steps below for an example of how to do this.  Create an empty MD shell in Microsoft Access.  Run Repository Translation Wizard from the Start Menu -> Programs -> MicroStrategy-> Object Manager In the "Metadata Repository" screen, select the "Project Source Name" and check the "Export Translations" option, as shown in the following screen shot: In the "Languages" screen, select a project, a translation reference language and a language (choose English as default), as shown in the following screen shot: In the "Select objects" screen, if one needs to select a certain type of object, check the option  Use the results of a search object .  Then, click 'New' to...

Update the data on an Intelligent Cube without having to republish the entire cube in MicroStrategy

Update the data on an Intelligent Cube without having to republish the entire cube in MicroStrategy MicroStrategy has introduced a feature known as, Incremental Refresh Options, which allow Intelligent Cubes to be updated based on one or more attributes, by setting up incremental refresh settings to update the Intelligent Cube with only new data. This can reduce the time and system resources necessary to update the Intelligent Cube periodically versus a full republish. For example, if a user has an Intelligent Cube that contains weekly sales data, the user may want this Intelligent Cube to be updated at the end of every week with the sales data for that week. By setting up incremental refresh settings, he can make it so that only data for one week is added to the Intelligent Cube, without affecting the existing data and without having to reload all existing data. Users can select t...

Create an alert-based subscription in MicroStrategy Distribution Services

Create an alert-based subscription in MicroStrategy Distribution Services on Web Subscription to a report or Report Services document which will be executed when a certain conditional threshold is met based on another executing report. For example, a scheduled report executes which shows the Revenue by day for the past week. If the Revenue on any one day falls below a certain value, a subscription to another report or Report Services document can be triggered and delivered to a recipient. An alert based subscription can only be created directly on a report; however, another report or Report Services document can be delivered when the alert based subscription is triggered. Note: you need a grid report to create an alert and you cannot create if you want to create on a document with text boxes. The following example will walk through the basic steps on how to setup a subscription based on an alert like this: Follow the brief  steps bel...