
HyperIntelligence and its Architecture

HyperIntelligence and its Architecture

When you open a web page the extension automatically scans web pages in your browser and underlines keywords that you can hover over to trigger cards. Cards present predefined KPIs associated with a selected keyword sourced securely from MicroStrategy.

This feature is similar to what we see in web pages particularly stock related web sites. 
MicroStrategy introduced HyperCards, a new object that is built, managed, and deployed using MicroStrategy Workstation(Not by using Developer or Desktop as far as I know). Cards can be consumed in a web browser via the MicroStrategy HyperIntelligence Chrome extension and on iOS devices via the MicroStrategy HyperMobile app. This feature can help the users to inject Zero-Click Intelligence (as it requires the users to hover only and no need to click!) about customers, products, people, and more directly onto words within websites or web application or emails. This feature can display the content through the mobile devices to bring answers through relevant, context-based analytics.
HyperIntelligence assists the users to find a report without logging into the environment and then allows to locate relevant information. It brings answers directly to you through contextualized text analytics that is as simple as hovering over a highlighted word.
HyperIntelligence can be an interesting and exciting feature for all levels of report/analytics users as they can see the reports as they type on in emails as below:

Salient features of HyperIntelligence:
  • Enables the text analytics that is as simple as hovering over a highlighted word in your email or web browser.
  • HyperIntelligence automatically scans every web page and underlines relevant keywords. Hover over a highlighted word to see insights in real-time.
  • Each card can seamlessly combine information from multiple enterprise assets and applications.
  • The extension supports multiple cards for different use cases. Each card can point to a different keyword. Simply click the extension icon to see the list of available cards or toggle individual cards on or off.
  • By default, the extension will work with any web-based content, however it is possible to blacklist individual websites - disabling the extension's functionality.
Microstrategy 2019 enhances the HypeIntelligence features further by introducing vision voice screen etc with the the new features like Hypevoice, Hyperscreen and Hypervision.

Hypervoice:

This feature allows the users to ask questions to get instant answers through voice commands in a similar fashion as you interact with Alexa. MicroStrategy integration with Amazon Alexa or Google Home (Not sure about Apple Homepod integration) to turn analytics applications into a voice-enabled personal coach. Which could boost productivity by blending insights into existing workflows. Developers can leverage MSTR APIs to integrate with voice-controlled applications like Amazon Alexa and Google Home. With MSTR-developed NLG and voice recognition mechanisms, it could be easy to get answers to the business questions on the way to the next meeting. By integrating with voice technology or chatbots, it’s easy to deliver the right data, fast.
No alt text provided for this image

Hyperscreen:

Hyperscreen enables the personalized insights on every wall(screen) you walk through. It can turn a screen into a dynamic, intelligent display that presents a personalized view of information based on who is standing nearby. It uses the new feature called Digital Identity to transform offices and facilities into spaces that inspire data-driven collaboration and action.

Hypervision:

Here, the magic comes by embedding analytics with virtual reality. Hold up your device for an augmented reality experience that overlays insights on objects and surroundings. Use image recognition to scan products and check inventory, or use GPS location to get an instant customer brief as you walk into your meeting.

Architecture 

The above workflow can be described as:


  • HypeIntelligence extension from Google Chrome browser submits a REST API request to MicroStrategy cubes by requesting topic(attributes!) and metrics.Data received from MSTR cubes to the browser is cached.
  • When the user open the browser and opens a web page or types text in emails or open emails. 
  • The extension finds matches and highlights those matching keywords.
  • Users hovers the highlighted keyword.
  • Extension displays the hypercard as designed.
  • Once the extension gets the data it caches the data and display the data in Hypercards whenever a user hovers on the key word highlighted.
 Deliver Zero-Click Intelligence
 Combine Information from Multiple Systems
 Support Multiple Cards
 Blacklist Individual Websites

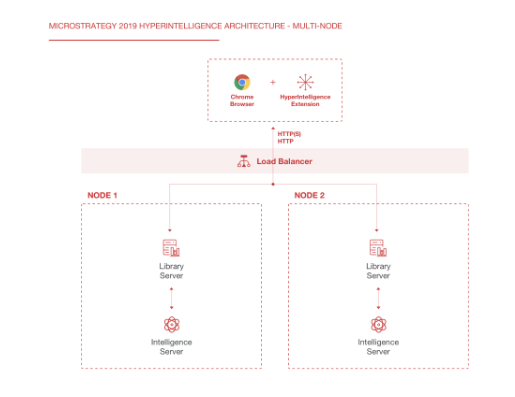
The architecture for HyperIntelligence is similar to MicroStrategy Library. MicroStrategy Library is a client application running on a desktop browser or a mobile device, whereas HyperIntelligence is currently only available as a Chrome browser extension
If we compare this architecture with the old Microstratgey architecture we see the additional component of MicroStrategy Library which makes all the magic of HyperIntelligence.
 Single node architecture

Multi Node Architecture:

Comparison between Single node i-server and multi node i-server:

HyperIntelligence Workflow 

Hover effects won’t work on mobile devices because there’s no mouse cursor. To overcome this MSTR has handled mobile links with high color and shape contrast on them so that user will know where to tap. So that it displays the cards.
I have not yet explored this feature when the email goes to external users and the data level security(security filters) work as we are not passing any security filters.Handling of row level security on the cards is still a mystery!

Comments

Post a Comment

Popular posts from this blog

Microstrategy Custom number formatting symbols

Custom number formatting symbols If none of the built-in number formats meet your needs, you can create your own custom format in the Number tab of the Format Cells dialog box. Select  Custom  as the Category and create the format using the number format symbols listed in the table below. Each custom format can have up to four optional sections, one each for: Positive numbers Negative numbers Zeros Text Each section is optional. Separate the sections by semicolons, as shown in the example below: #,###;(#,###);0;"Error: Entry must be numeric" For more examples, see  Custom number formatting examples . To jump to a section of the formatting symbol table, click one of the following: Numeric symbols Character/text symbols Date and time symbols Text color symbols Currency symbols Conditional symbols Numeric symbols For details on how numeric symbols apply to the Big Decimal data type, refer to the  Project Design Guide . ...

Case functions Microstrategy

Ca se functions Microstrategy Case functions return specified data in a SQL query based on the evaluation of user-defined conditions. In general, a user specifies a list of conditions and corresponding return values. Case This function evaluates multiple expressions until a condition is determined to be true, then returns a corresponding value. If all conditions are false, a default value is returned.  Case  can be used for categorizing data based on multiple conditions. This is a single-value function. Syntax Case ( Condition1 ,  ReturnValue1 ,  Condition2 , ReturnValue2 ,...,  DefaultValue ) Example Case(([Total Revenue] < 300000), 0, ([Total Revenue] < 600000), 1, 2) sum(Case (Day@DESC in (“Sat”,”Sun”), Sales, 0) {~+} Sum(Case(Category@DESC In("Books","Electronics"),Revenue,0)){~+} CaseV (case vector) CaseV  evaluates a single metric and returns different values according to the results. It can be used to perfo...

Settings for Outer Join between metrics in MicroStrategy

Settings for Outer Join between metrics in MicroStrategy MicroStrategy adopts multi-pass logic to determine the execution plan for a report. This means that every metric is evaluated in separate SQL passes. Outer Joins come into play when MicroStrategy Engine merges the results from all SQL passes into one report. For a multi-pass report, different Outer Join behaviors can give the user completely different results. In addition, report metrics can be of different types which can, in some cases, influence the result of the outer join. In MicroStrategy, there are two settings that users can access to control Outer Join behavior : Formula Join Type and Metric Join Type . Metric Join Type: VLDB Setting at Database Instance Level Report and Template Levels Report Editor > Data > Report Data Options Metric Level   Metric editor > Tools > Metric Join Type Control Join between Metrics Formula Join Type: Only at Compound/Split...

MicroStrategy URL API Parameters

MicroStrategy URL Structure The following table summarizes the root URL structure used for every request to MicroStrategy Web. Environment Main Application URL Administration URL J2EE http://webserver/MicroStrategy/servlet/mstrWeb http://webserver/MicroStrategy/servlet/mstrWebAdmin .NET http://webserver/MicroStrategy/asp/Main.aspx http://webserver/MicroStrategy/asp/Admin.aspx Every request sent to MicroStrategy Web calls a central controller. Parameters are appended to  Main.aspx  or  mstrWeb  (in a .NET and J2EE environment, respectively) to indicate to the controller how the request should be internally forwarded and handled. The following examples show a URL for accessing a MicroStrategy folder when the user does not have an existing session. The URL contains not only the parameters needed to connect to MicroStrategy Web, but also the parameters needed to log on and create a session. J2EE environment: <a href="http:...

Custom Subtotal Displays in MicroStrategy

Defining custom subtotal displays in MicroStrategy By default, when users apply subtotals in a report, the name of the subtotal is displayed in the subtotal line items that appear in the report. Users can use custom subtotals to give more control over the characteristics of a subtotal. Custom subtotals allow users to define custom subtotal line items that appear on the reports  U sers can make the subtotal name dynamic by typing special characters in the subtotal name field as listed in the following table. Character Description #A The name of the attribute under which the subtotal appears. #P The name of the attribute to the left of, or above the attribute under which the subtotal appears. #0 All the forms of the parent element. #1 The first form of the parent element reading from left to right or from top to bottom. #2 The second form of the parent element reading from left to right or from top to bottom. #3 The third form of th...

Fact tables levels tables in Microstrategy explained

Fact tables levels in Microstrategy: Fact tables are used to store fact data. Fact tables should contain attribute Id's and fact values which are measurable. All the descriptive information about the fact tables should stored in Dimension tables either in Star Schema fashion or Snow Flake Schema fashion which is best suited to your reporting solution. Since attributes provide context for fact values, both fact columns and attribute ID columns are included in fact tables. Facts help to link indirectly related attributes using these attribute ID columns. The attribute ID columns included in a fact table represent the level at which the facts in that table are stored. So the level of a fact table in the Fact_Item_Day_Customer can be the attribute Id's which is at Day, Item & Customer Id level. For example, fact tables containing sales and inventory data look like the tables shown in the following diagram: Base fact columns ver...

Error. Engine Attribute Role Limit Exceeded! To get rid off this error: (1) Turn off Engine Attribute Role setting in VLDB dialog

Error. Engine Attribute Role Limit Exceeded! Some times Microstrategy will give the below error when updating the schema after an attribute is created. MicroStrategy Developer --------------------------- Error(s) occurred while loading schema: [DFCSCHEMA] Population Exception: The object shown in the following hierarchy no longer exists in schema: -Table LKUP_TEST_FEE_SHIPMENTS error. Engine Attribute Role Limit Exceeded! To get rid off this error: (1) Turn off Engine Attribute Role setting in VLDB dialog; OR (2) Use Table Alias featureDSSSQLEngine: Schema loading error: Message from GetErrorInfo : Report cache is not found.. Error(s) occurred while loading schema: 63. CAUSE: This error message means that the table shown in the error text needs to be split into a very large number tables. MicroStrategy has a limitation that only allows one table to be split into no more than 100 tables. The error above is shown when this limitation is surpassed....

Microstrategy Dossier training videos

Microstrategy Dossier training videos Adding data to a Dossier: Creating a visualization filter in Dossier: Sending Dossier to User libraries: How to format Dossiers: Adding a designer filter to a Dossier: Use Bookmarks in Dossiers: Dynamic Links in Dossier: Recreating documents from Dossiers: Exploring and searching in Dossiers: Exploring sample dossiers in MSTR library: Using Page to Page Targets in Dossiers:

Relative path for images in Microstartegy

Best practices on how to reference an image specified using a relative path for exported documents in MicroStrategy If possible, users should use HTTP paths to reference an image other than relative path or absolute path. If it is necessary to use a relative path to reference image, multiple locations need to store the copy of image as shown in the following table: Important notes: MicroStrategy Web Server is not involved in storing image when exporting. Image should be stored in Intelligence Server or MicroStrategy Developer Client For MicroStrategy Developer export, local MicroStrategy Developer handles the export, image should be placed on every single Developer machine If you don't know your Common Path or MSTR Home Path you can obtain them from the following registry keys if using windows or msireg.reg if using Unix HKEY_LOCAL_MACHINE --> SOFTWARE -->Microstrategy --> DSS Server -> Casetor -->Home Path HKEY_LOCAL_MACHINE --> SO...

Control the display of null and zero metric values

Show   Control the display of null and zero metric values in a grid report You can determine how to display or hide rows and columns in a grid report that consist only of null or zero metric values. You can have MicroStrategy hide the rows and columns in the following ways: Hide rows and columns that consist only of null metric values Hide rows and columns that consist only of zero metric values Hide rows and columns that consist only of null or zero metric values (default) Once you have defined how MicroStrategy hides null and zero metric values in the grid, you can quickly show or hide the grid using the Hide Nulls/Zeros option in the Data menu, as described below, or by clicking the  Hide Nulls/Zeros  icon  in the Data toolbar. To determine how null and zero metric values are displayed or hidden in a grid report Open the report in Edit mode. From the  Tools  menu, select  Report Options . The Report Options...