
Reduce Intelligent Cube Size By Finding Intelligent Cube Objects Which Are Not In Use

Reduce Intelligent Cube Size By Finding Intelligent Cube Objects Which Are Not In Use


If the i-cubes can potentially be reduced in size an audit can be performed on the cube objects to see which cube objects are not being used by any of the view reports, documents, or dossiers.  
The below are examples for a few of the common metadata database platforms.

NOTE: To perform this audit, queries are run against the MicroStrategy metadata database. Ensure a metadata backup is taken prior to performing the below actions.

Steps:
1) Identify the object ID of the Intelligent cube to be audited by checking the objects Property window
2) Identify the object ID of the project this cube exists within by opening the Project Configuration

Sample Cube ID = CFAF1E9B4D53990698C42E87C7AF2EB5
Sample Project ID = B7CA92F04B9FAE8D941C3E9B7E0CD754
 
3) Run the below SQL against the metadata database by replacing the Cube ID and Project ID within the respective location.

The following is the syntax for a MySQL metadata:
select a13.OBJECT_NAME, a13.OBJECT_ID,  a13.OBJECT_TYPE, a13.PROJECT_ID, a13.PARENT_ID from DSSMDOBJINFO a13 where Object_ID in (SELECT a12.DEPN_OBJID as Object_ID FROM DSSMDOBJDEPN a12 where a12.object_id = ('CFAF1E9B4D53990698C42E87C7AF2EB5') and a12.DEPN_OBJID not in (SELECT distinct a11.DEPN_OBJID FROM DSSMDOBJDEPN a11 where object_id in (SELECT OBJECT_ID FROM DSSMDOBJDEPN where depn_objid = ('CFAF1E9B4D53990698C42E87C7AF2EB5')))) and a13.PROJECT_ID = 'B7CA92F04B9FAE8D941C3E9B7E0CD754';

4) Review the results returned to quickly identify which attributes/metrics within the cube are not being used.


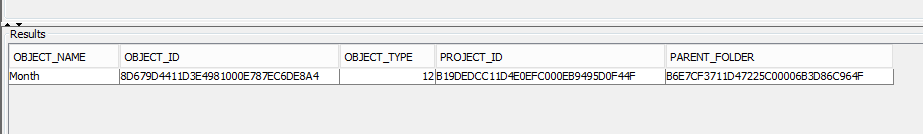
From these results it can be determined that the Month attribute is not being used within any of the view Reports, Documents, Dossiers that reference this Intelligent Cube.  At this point, the Month attribute can be removed from the cube to reduce the publication time and size of the Intelligent Cube within memory.


Other metadata database platforms:

SQL Server:
select a13.OBJECT_NAME,  dbo.fn_UniqueIdentifierToCharMSTR(a13.OBJECT_ID) as OBJECT_ID, a13.OBJECT_TYPE as OBJECT_TYPE, dbo.fn_UniqueIdentifierToCharMSTR(a13.PROJECT_ID) as PROJECT_ID,  dbo.fn_UniqueIdentifierToCharMSTR(a13.PARENT_ID) as PARENT_FOLDER from dbo.DSSMDOBJINFO as a13 where Object_ID in (SELECT a12.DEPN_OBJID as Object_ID FROM dbo.DSSMDOBJDEPN as a12 where a12.object_id = dbo.fn_CharToUniqueIdentifier('CFAF1E9B4D53990698C42E87C7AF2EB5') and a12.DEPN_OBJID not in (SELECT distinct a11.DEPN_OBJID FROM dbo.DSSMDOBJDEPN as a11 where object_id in (SELECT OBJECT_ID FROM dbo.DSSMDOBJDEPN where depn_objid = dbo.fn_CharToUniqueIdentifier('CFAF1E9B4D53990698C42E87C7AF2EB5')))) and a13.project_id= dbo.fn_CharToUniqueIdentifier('B7CA92F04B9FAE8D941C3E9B7E0CD754');

Oracle:
select a13.OBJECT_NAME, a13.OBJECT_ID, a13.OBJECT_TYPE, a13.PROJECT_ID, a13.PARENT_ID from DSSMDOBJINFO a13 where Object_ID in (SELECT a12.DEPN_OBJID as Object_ID FROM DSSMDOBJDEPN a12 where a12.object_id = ('CFAF1E9B4D53990698C42E87C7AF2EB5') and a12.DEPN_OBJID not in (SELECT distinct a11.DEPN_OBJID FROM DSSMDOBJDEPN a11 where object_id in (SELECT OBJECT_ID FROM DSSMDOBJDEPN where depn_objid = ('CFAF1E9B4D53990698C42E87C7AF2EB5')))) and a13.PROJECT_ID = 'B7CA92F04B9FAE8D941C3E9B7E0CD754';

Comments

Popular posts from this blog

Microstrategy Custom number formatting symbols

Custom number formatting symbols If none of the built-in number formats meet your needs, you can create your own custom format in the Number tab of the Format Cells dialog box. Select  Custom  as the Category and create the format using the number format symbols listed in the table below. Each custom format can have up to four optional sections, one each for: Positive numbers Negative numbers Zeros Text Each section is optional. Separate the sections by semicolons, as shown in the example below: #,###;(#,###);0;"Error: Entry must be numeric" For more examples, see  Custom number formatting examples . To jump to a section of the formatting symbol table, click one of the following: Numeric symbols Character/text symbols Date and time symbols Text color symbols Currency symbols Conditional symbols Numeric symbols For details on how numeric symbols apply to the Big Decimal data type, refer to the  Project Design Guide . ...

MicroStrategy URL API Parameters

MicroStrategy URL Structure The following table summarizes the root URL structure used for every request to MicroStrategy Web. Environment Main Application URL Administration URL J2EE http://webserver/MicroStrategy/servlet/mstrWeb http://webserver/MicroStrategy/servlet/mstrWebAdmin .NET http://webserver/MicroStrategy/asp/Main.aspx http://webserver/MicroStrategy/asp/Admin.aspx Every request sent to MicroStrategy Web calls a central controller. Parameters are appended to  Main.aspx  or  mstrWeb  (in a .NET and J2EE environment, respectively) to indicate to the controller how the request should be internally forwarded and handled. The following examples show a URL for accessing a MicroStrategy folder when the user does not have an existing session. The URL contains not only the parameters needed to connect to MicroStrategy Web, but also the parameters needed to log on and create a session. J2EE environment: <a href="http:...

mstrio – Python and R wrappers for the MicroStrategy

mstrio – Python and R wrappers for the MicroStrategy REST APIs Connecting to MicroStrategy  Create a connection to the Intelligence Server using   Connection()   and    connect()  in Python and R, respectively. Required arguments for the   Connection()  function are the URL for the MicroStrategy REST API server, MicroStrategy Intelligence Server username and password, as well as the MicroStrategy project name. By default, the   connect()  function anticipates your MicroStrategy Intelligence Server username and password. LDAP authentication is also supported. Use the optional argument    login_mode=16    in the    connect()  function for LDAP authentication.  Extract data from cubes and reports  To extract data from MicroStrategy cubes and reports, use the   get_cube()  and   get_report()  functions. Use...

Metric values are repeated across rows when a report is executed in MicroStrategy

Metric values are repeated across rows when a report is executed in MicroStrategy When comparing report results between DB Query Tool and MicroStrategy, some reports show repeated metric values in MicroStrategy where there were none in DB Query Tool. To illustrate the issue, a fact table CAT_ITEM_SLS has been added into the MicroStrategy Tutorial project and populated with a small set of three rows. CAT_ID ITEM_ID REVENUE  1 1  10   1 2  20  2  2  30  Report results in DB Query Tool: Report results in MicroStrategy: In MicroStrategy, the row for "Art As Experience" in the Spring 2007 catalog repeats the $20 value from the Winter 2007 catalog, where DB Query Tool shows the $30 value from the fact table. CAUSE The discrepancy occurs because the attribute elements for Catalog and Item are in a many-to-many relationship, but the attribute relationship in the MicroStrategy schema is defined incorrectly w...

Microstrategy Dossiers explained

Microstrategy  Dossiers With the release of MicroStrategy 10.9, we’ve taken a leap forward in our dashboarding capabilities by simplifying the user experience, adding storytelling, and collaboration.MSTR has  evolved dashboards to the point that they are more than dashboards - they are  interactive, collaborative analytic stories . Ultimately, it was time to go beyond dashboards, both in concept and in name, and so  the've  renamed VI dashboards to  ‘ dossiers ’.  Dossiers can be created by using the new Desktop product or Workstation or simply from the Web interface which replaces Visual Insights. All the existing visual Insights dashboards will be converted to Dossiers   With MicroStrategy 10.9, there was an active focus on making it easier to build dashboards for the widest audience of end users. To achieve this, some key new capabilities were added that make it easier to author, read, interact and collaborate on dashboards ...

Control the display of null and zero metric values

Show   Control the display of null and zero metric values in a grid report You can determine how to display or hide rows and columns in a grid report that consist only of null or zero metric values. You can have MicroStrategy hide the rows and columns in the following ways: Hide rows and columns that consist only of null metric values Hide rows and columns that consist only of zero metric values Hide rows and columns that consist only of null or zero metric values (default) Once you have defined how MicroStrategy hides null and zero metric values in the grid, you can quickly show or hide the grid using the Hide Nulls/Zeros option in the Data menu, as described below, or by clicking the  Hide Nulls/Zeros  icon  in the Data toolbar. To determine how null and zero metric values are displayed or hidden in a grid report Open the report in Edit mode. From the  Tools  menu, select  Report Options . The Report Options...

Configure a report for use with Bulk Export in MicroStrategy

Configure a report for use with Bulk Export in MicroStrategy The Bulk Export feature enables a large report to be saved as a delimited text file. Using this feature, it is possible to retrieve result sets from a large dataset without having to load the entire dataset into memory. PS:  Once a report is setup for bulk export it cannot be used as a regular report. So if the report needs to be run as a normal report and as a bulk export report, the first step is to make a copy of the report for use with bulk export. Configure Bulk Export Bulk Export options are only available in MicroStrategy Developer. Open a 3-tier connection using MicroStrategy Developer and edit the desired report. Go to 'Data' on the top menu bar. Select 'Configure Bulk Export': Specify any additional desired configuration options. General Settings Bulk export database instance : This is the database instance to use to store the bulk export results. Temporary tables w...

Microstrategy Report Services documents and dashboards

Microstrategy Report Services documents vs Dashboards A MicroStrategy Report Services document displays data coming from multiple reports, with the data laid out and designed in presentation-quality format. Most data on a document is from one or more underlying datasets. A dataset is a standard MicroStrategy report. Other document components that do not originate from the dataset, such as static text used for a title or heading, page numbers, and images, are added by the document's designer and are stored in the document's definition. A Report Services (RS) dashboard is a special type of document. An RS dashboard is commonly only one page long, is intended to be viewed online, and usually provides interactive features that let analysts change how they view the dashboard’s data, as well as what data they are viewing. A broad selection of widgets and a wide variety of formatting options allow you to design a customized, interactive dashboard. Both documents and RS dashb...

Prompt-in-prompt(Nested Prompts) in Microstrategy

Prompt-in-prompt(Nested Prompts) in  Microstrategy Nested prompts allows you to create one prompt based on the other and other bases on another, nested prompts allows us to prompt the highest level(Like year) to middle level(like Quarter, then to the low level(like Month). Here you can see how to  create a 3-level deep nested prompt that will prompt the user to select a year, then a quarter within that year, then a month within that quarter. Prompt-in-prompt is a feature in which the answer to one prompt is used to define another prompt. This feature is only implemented for element list prompts . The following procedure describes how to achieve this: Create the highest level filter. This is a filter which contains a prompt on an attribute element list. Create a filter on the attribute "Year." Click "prompt on attribute element list" and click "Next" through the rest of the screens to accept the default values. Do not set any additio...

Transaction Services - Configure Transactions

Configure Transactions in MSTR Web Transaction Services-enabled document displayed on an iPhone, iPad, or Android device can allow users to insert/update/delete data in to the database, using the options in the Configure Transactions Editor. To do so, you must link a Transaction Services report to a grid or to text fields in a panel stack. If the document is being displayed on an iOS device, you can link the report to the cells of a transaction table. Data from the input objects defined in the Transaction Services report is displayed in the grid, text fields, or cells for users to edit. Prerequisites:        Ø   You must have the Web Configure Transaction privilege assigned by MSTR user admin. Ø   Create the Transaction Services report (usually a grid report) you want to link to the grid, text fields, or transaction table cells. Make sure that the Transaction Services report must contain the input object for each value you w...