
Multi-Select Drop Down Selector with Apply Button

Multi-Select Drop Down Selector with  OK Button 


When creating a Report Services Document, you may want to create a drop down selector to save space, but also would like the drop down to be a multi-selector with OK/Apply button. Below are instructions to achieve this in a Report Services Document. 

User-added image

Steps to Create:

1. Right click on your drop down selector and choose Properties and Formatting

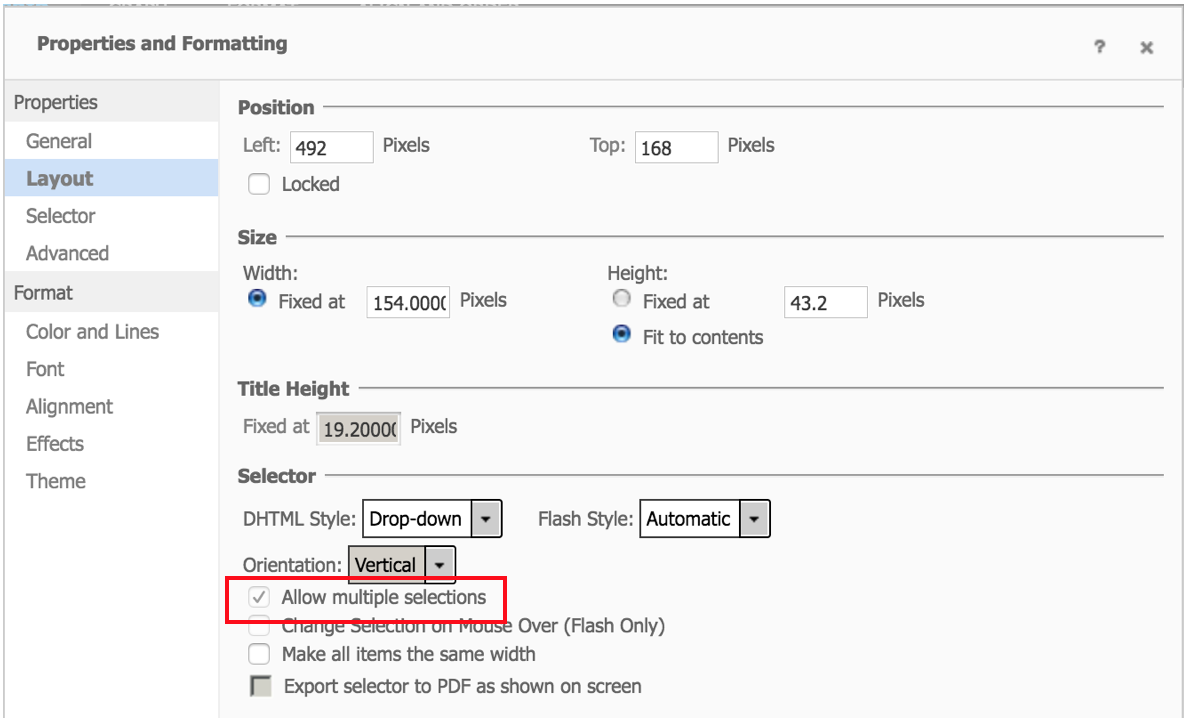
2. Navigate to the Layout Tab

3. In the layout tab, click "Allow multiple selections". It will not indicate that the check box is enabled, but this step is mandatory. 
User-added image
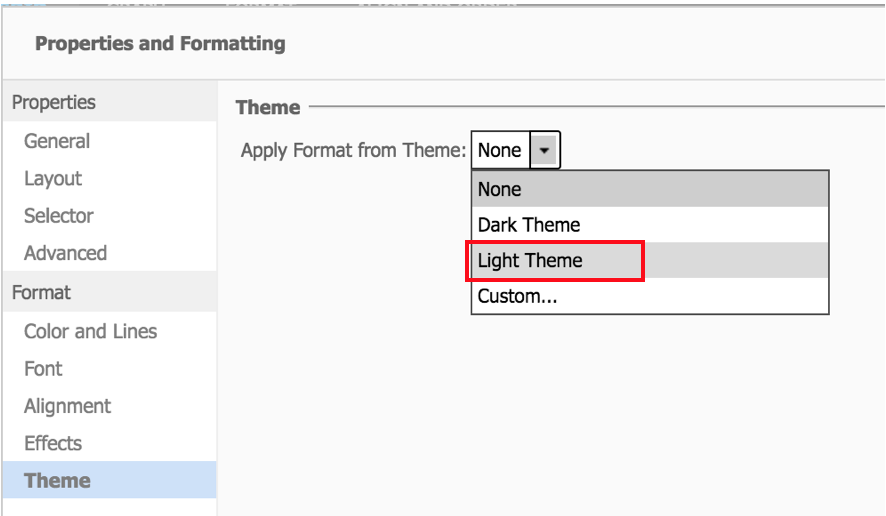
3. Next, navigate to the Theme tab. Choose the Light Theme from the drop down menu and click the Apply button.
User-added image

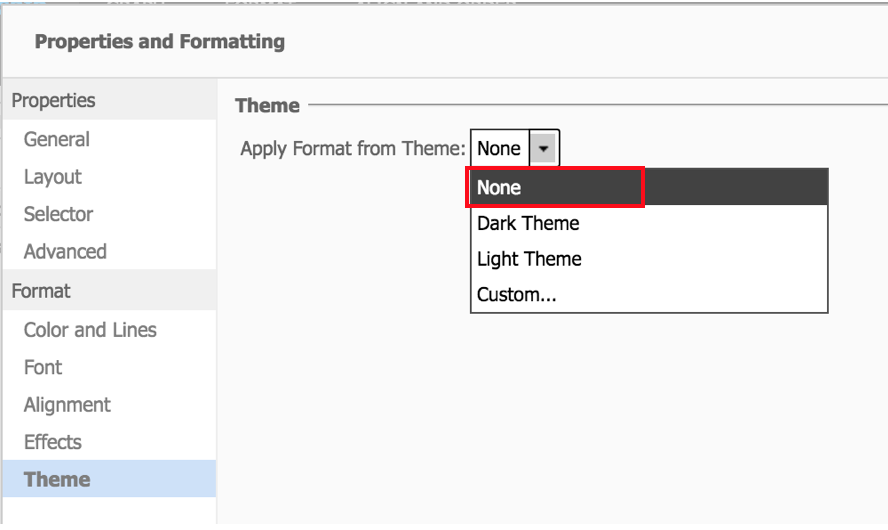
4) Next, change the Theme back to None and click Apply.
User-added image
4. When you return to the Layout tab, you will see the checkbox for Allow multiple selections is now checked.
User-added image
 

Comments

Popular posts from this blog

Case functions Microstrategy

Ca se functions Microstrategy Case functions return specified data in a SQL query based on the evaluation of user-defined conditions. In general, a user specifies a list of conditions and corresponding return values. Case This function evaluates multiple expressions until a condition is determined to be true, then returns a corresponding value. If all conditions are false, a default value is returned.  Case  can be used for categorizing data based on multiple conditions. This is a single-value function. Syntax Case ( Condition1 ,  ReturnValue1 ,  Condition2 , ReturnValue2 ,...,  DefaultValue ) Example Case(([Total Revenue] < 300000), 0, ([Total Revenue] < 600000), 1, 2) sum(Case (Day@DESC in (“Sat”,”Sun”), Sales, 0) {~+} Sum(Case(Category@DESC In("Books","Electronics"),Revenue,0)){~+} CaseV (case vector) CaseV  evaluates a single metric and returns different values according to the results. It can be used to perfo...

MicroStrategy URL API Parameters

MicroStrategy URL Structure The following table summarizes the root URL structure used for every request to MicroStrategy Web. Environment Main Application URL Administration URL J2EE http://webserver/MicroStrategy/servlet/mstrWeb http://webserver/MicroStrategy/servlet/mstrWebAdmin .NET http://webserver/MicroStrategy/asp/Main.aspx http://webserver/MicroStrategy/asp/Admin.aspx Every request sent to MicroStrategy Web calls a central controller. Parameters are appended to  Main.aspx  or  mstrWeb  (in a .NET and J2EE environment, respectively) to indicate to the controller how the request should be internally forwarded and handled. The following examples show a URL for accessing a MicroStrategy folder when the user does not have an existing session. The URL contains not only the parameters needed to connect to MicroStrategy Web, but also the parameters needed to log on and create a session. J2EE environment: <a href="http:...

Apply or Pass-through functions in Microstrategy

Ap ply (Pass-Through) functions MSTR Apply functions provide access to functions or syntactic constructs that are not standard in MicroStrategy but are provided by various RDBMS systems.. Syntax common to Apply functions Apply Function Name   ("expression with placeholders", Arg1, Arg2, Arg3, …ArgN) where: Apply Function Name  – is a generic name used for the predefined pass-through functions described above expression with placeholders  – is the string describing the actual expression or syntax that the engine uses while generating the SQL and which is sent to the RDBMS. The placeholders are represented by #0, #1, and so on. "#" is a reserved character for MicroStrategy. Arg  – is an argument that replaces the parameter markers in the pattern. Arg1 replaces #0, Arg2 replaces #1, and so on. There are   five  pre-defined Apply functions to replace regular, predefined functions of the same type. For more details, cli...

Execute Integrity manager test from Command line

Execute Integrity manager test from Command line  MSTR Integrity Manager allows the user to execute a test without having to load the GUI, or to schedule a test to run later at specific times or dates. Go over using Windows AT command at: https://support.microsoft.com/en-us/help/313565/how-to-use-the-at-command-to-schedule-tasks https://www.lifewire.com/at-command-2618090 Here are the prerequisites to execute a test from the command line: Create a test and saved using the Integrity Manager graphical interface. Make sure that the users has the ' Use Integrity Manager ' privilege for that project(provided by the administrator) and the ' Execute ' permission for the reports to be tested. Keep in mind that MicroStrategy Integrity Manager can only test three-tier projects, i.e., projects which are connected to a MicroStrategy i- Server. Projects in Direct Connection (two-tier) mode cannot be tested with this tool...

Fiscal Week, Fiscal Month, Fiscal Quarter and Fiscal Year calculations in Microstrategy

Fiscal Week, Fiscal Month, Fiscal Quarter and Fiscal Year calculations in Microstrategy FiscalWeek Returns the numeric position of a week within a fiscal year, for a given  input date. This function is useful in financial reporting when the start of the fiscal year is different than the start of the calendar year. Syntax FiscalWeek< firstWeekDay ,  firstMonth >( Date / Time ) Where: • Date / Time  is the input date or timestamp. • firstWeekDay  (default value is 1) is a parameter that determines which day of the week is considered as the first day of the week. You can type an integer value from 1 to 7, with 1 representing Sunday, 2 representing Monday, and so on until 7 representing Saturday. • firstMonth  (default value is 1) is a parameter that determines which month is considered as the start of the fiscal year. You can type an integer value from 1 to 12, with 1 representing January, 2 representing February, and so on until ...

Control the display of null and zero metric values

Show   Control the display of null and zero metric values in a grid report You can determine how to display or hide rows and columns in a grid report that consist only of null or zero metric values. You can have MicroStrategy hide the rows and columns in the following ways: Hide rows and columns that consist only of null metric values Hide rows and columns that consist only of zero metric values Hide rows and columns that consist only of null or zero metric values (default) Once you have defined how MicroStrategy hides null and zero metric values in the grid, you can quickly show or hide the grid using the Hide Nulls/Zeros option in the Data menu, as described below, or by clicking the  Hide Nulls/Zeros  icon  in the Data toolbar. To determine how null and zero metric values are displayed or hidden in a grid report Open the report in Edit mode. From the  Tools  menu, select  Report Options . The Report Options...

Microstrategy document/dashboard applying selections as filters or slices

Applying selections as filters or slices In a Microstrategy Document the selections a user makes in a selector can either filter or slice the data in the target: Filtering means that the data for the current selection is calculated only when it is requested by the user. The selections are used to filter the underlying dataset before the metric values are aggregated at the level of the Grid/Graph that is displayed in the document. If the source attribute is not included in the Grid/Graph, the metric values from all the selected elements are aggregated and shown at the level specified in the Grid/Graph. All metric condition selectors (which filter metric values or ranks) and selectors that target other selectors filter data by default. You cannot change them to slicing selectors. Slicing means that the data for each available item in the selector is calculated in advance when the document is first displayed. Selections made while ...

Microstrategy Custom number formatting symbols

Custom number formatting symbols If none of the built-in number formats meet your needs, you can create your own custom format in the Number tab of the Format Cells dialog box. Select  Custom  as the Category and create the format using the number format symbols listed in the table below. Each custom format can have up to four optional sections, one each for: Positive numbers Negative numbers Zeros Text Each section is optional. Separate the sections by semicolons, as shown in the example below: #,###;(#,###);0;"Error: Entry must be numeric" For more examples, see  Custom number formatting examples . To jump to a section of the formatting symbol table, click one of the following: Numeric symbols Character/text symbols Date and time symbols Text color symbols Currency symbols Conditional symbols Numeric symbols For details on how numeric symbols apply to the Big Decimal data type, refer to the  Project Design Guide . ...

Prompt-in-prompt(Nested Prompts) in Microstrategy

Prompt-in-prompt(Nested Prompts) in  Microstrategy Nested prompts allows you to create one prompt based on the other and other bases on another, nested prompts allows us to prompt the highest level(Like year) to middle level(like Quarter, then to the low level(like Month). Here you can see how to  create a 3-level deep nested prompt that will prompt the user to select a year, then a quarter within that year, then a month within that quarter. Prompt-in-prompt is a feature in which the answer to one prompt is used to define another prompt. This feature is only implemented for element list prompts . The following procedure describes how to achieve this: Create the highest level filter. This is a filter which contains a prompt on an attribute element list. Create a filter on the attribute "Year." Click "prompt on attribute element list" and click "Next" through the rest of the screens to accept the default values. Do not set any additio...

The logical table size calculation in Microstrategy

The logical table size calculation in Microstrategy The logical table size is an integer number that represents the granularity or level of aggregation of a particular table. It is called 'logical' because it is not related to the physical size of the tables (number of rows). It is calculated according to the attribute IDs that are present in the table and their level in the system hierarchy.   Even though, the number does not reveal the actual number of rows in the table, it is an accurate way of measuring a table size without having to access its contents.   MicroStrategy Engine utilizes an algorithm based on attribute keys to calculate the Logical Table Size (LTS):   Given the following tables:     The algorithm that calculates the table sizes performs the following steps: Calculate the number of levels per hierarchy: Hierarchy 1: 3 Hierarchy 2: 4 Calculate each attribute individual weight according to the level in the hierarchy (level in hierarchy/number of ...